remotes::install_github("GuangchuangYu/nCov2019")
remotes::install_github("GuangchuangYu/chinamap")17 ncov2019
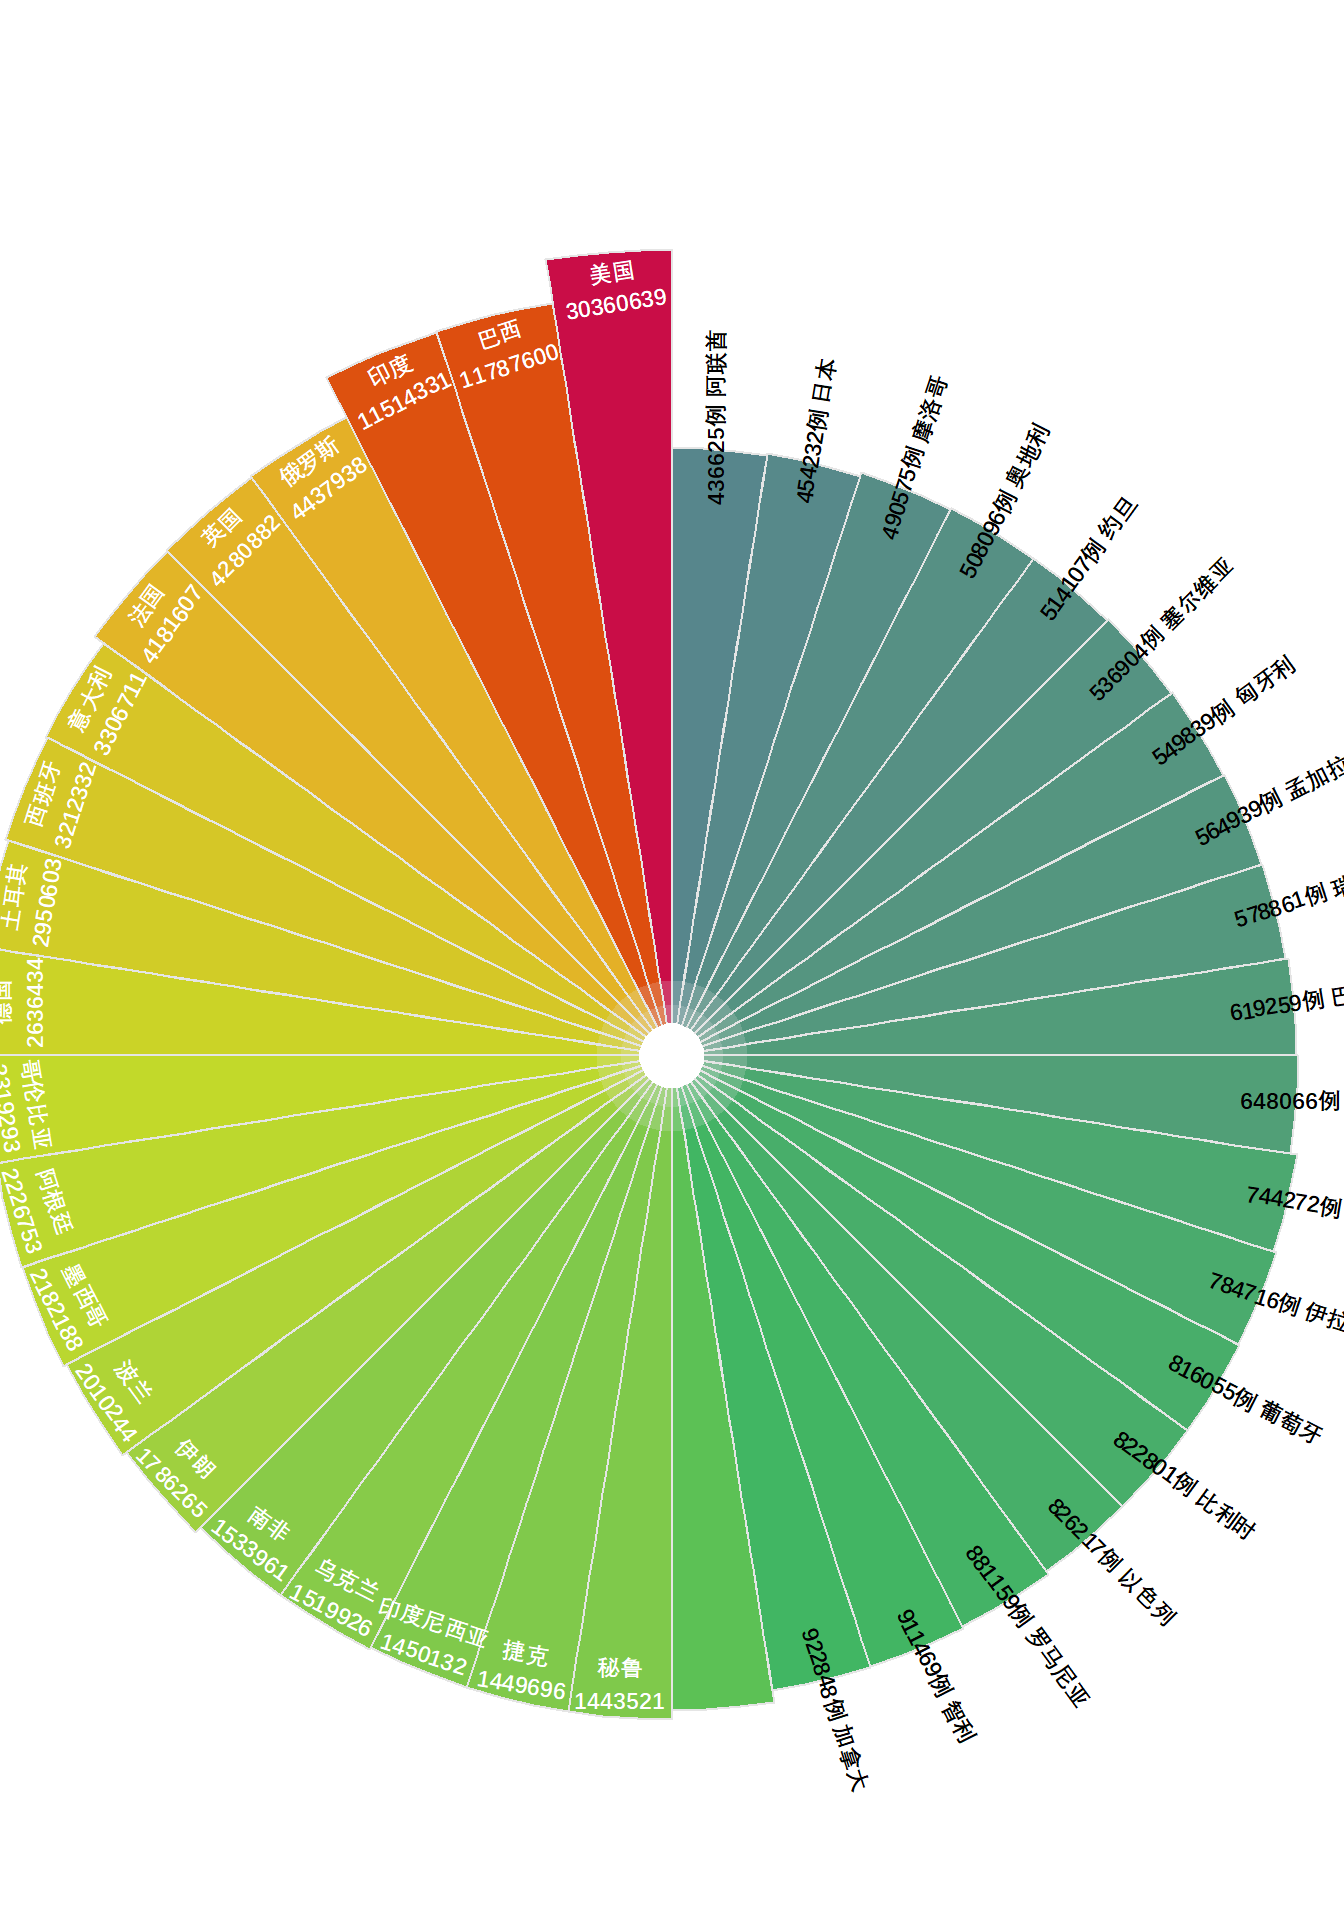
17.1 全球疫情形势
── Attaching packages ─────────────────────────────────────── tidyverse 1.3.2 ──
✔ ggplot2 3.3.6      ✔ purrr   0.3.5
✔ tibble  3.1.8      ✔ dplyr   1.0.10
✔ tidyr   1.2.1      ✔ stringr 1.4.1
✔ readr   2.1.3      ✔ forcats 0.5.2
── Conflicts ────────────────────────────────────────── tidyverse_conflicts() ──
✖ dplyr::filter() masks stats::filter()
✖ dplyr::lag()    masks stats::lag()
y = load_nCov2019(lang='zh')# 可改为en
d = y['global']
dd <- filter(d, time == time(y) & country != '中国') %>%
arrange(desc(cum_confirm))
dd = dd[1:40, ]
dd$country = factor(dd$country, levels=dd$country)
dd$angle = 1:40 * 360/40
i = dd$angle > 90 & dd$cum_confirm > dd$cum_confirm[21]
dd$angle[i] = dd$angle[i] + 180
dd$vjust = 1
dd$vjust[i] = 0
as_tibble(dd)# A tibble: 40 × 7
time country cum_confirm cum_heal cum_dead angle vjust
<date> <fct> <int> <int> <int> <dbl> <dbl>
1 2021-03-19 美国 30360639 22523803 552475 9 1
2 2021-03-19 巴西 11787600 10339432 287795 18 1
3 2021-03-19 印度 11514331 11083679 159405 27 1
4 2021-03-19 俄罗斯 4437938 4049373 94267 36 1
5 2021-03-19 英国 4280882 3593136 125926 45 1
6 2021-03-19 法国 4181607 278263 91679 54 1
7 2021-03-19 意大利 3306711 2655346 103855 63 1
8 2021-03-19 西班牙 3212332 2945446 72910 72 1
9 2021-03-19 土耳其 2950603 2770638 29777 81 1
10 2021-03-19 德国 2636434 2401413 75071 90 1
# … with 30 more rowsdata100_plus<-function(d) d[d$cum_confirm > dd$cum_confirm[21],]
data100_minus<-function(d) d[d$cum_confirm < dd$cum_confirm[21],]Code
windowsFonts(jianti=windowsFont("dengxian"))
p <- ggplot(dd, aes(country, cum_confirm, fill=cum_confirm)) +
  geom_col(width=1, color='grey90') +
  geom_col(aes(y=I(5)), width=1, fill='grey90', alpha = .2) +
  geom_col(aes(y=I(3)), width=1, fill='grey90', alpha = .2) +
  geom_col(aes(y=I(2)), width=1, fill = "white") +
  scale_y_log10() +
  #scale_fill_gradientn(colors=c("darkgreen", "green", "orange", "firebrick","red"), trans="log") +
  scale_fill_gradientn(colors=c("#57868c","#39bc5c","#c5da27","#eda027","#da400c","#c90d47"),
                       trans="log")+
  geom_text(aes(label=paste(country, cum_confirm, sep="\n"),
                y = cum_confirm *.8, angle=angle, vjust=vjust),
            data= data100_plus(dd),
            size=3, color = "white", fontface="bold",family="jianti")  +
  geom_text(aes(label=paste0(cum_confirm, "例 ", country),
                y = cum_confirm * 2, angle=angle+90),
            data= data100_minus(dd),
            size=3, vjust=0,fontface="bold",family="jianti") +
  coord_polar(direction=-1) +
  theme_void() +
  theme(legend.position="none")

ggplotify::as.ggplot(p, scale=1.25, vjust=-.05, hjust=0)