2 aes()
2.1 映射坐标属性

2.2 映射其它属性
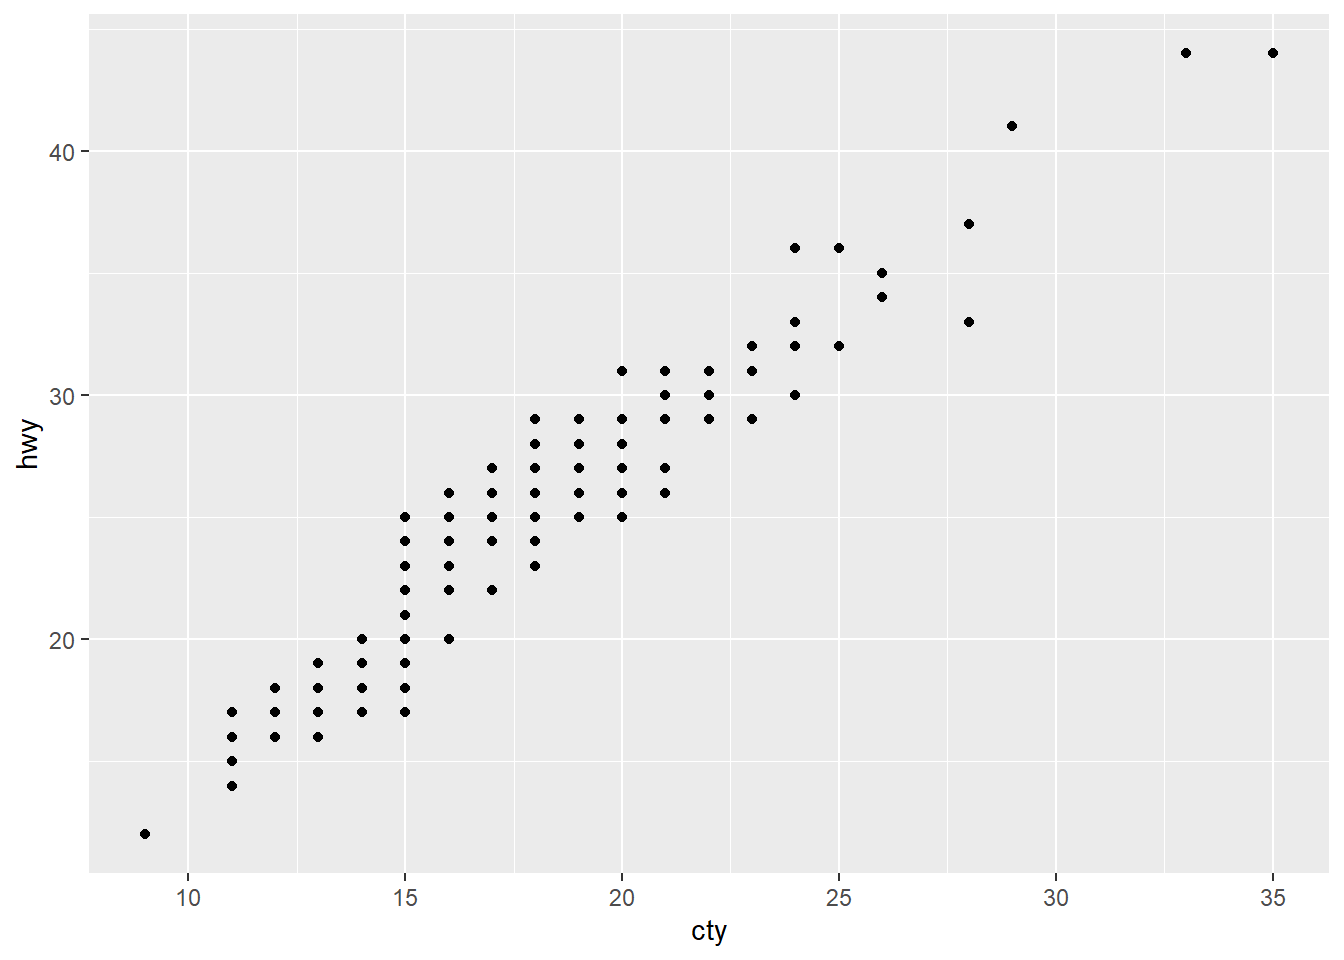
p<-ggplot(mpg,aes(x=cty,y=hwy))
p+geom_point(aes(size=cyl))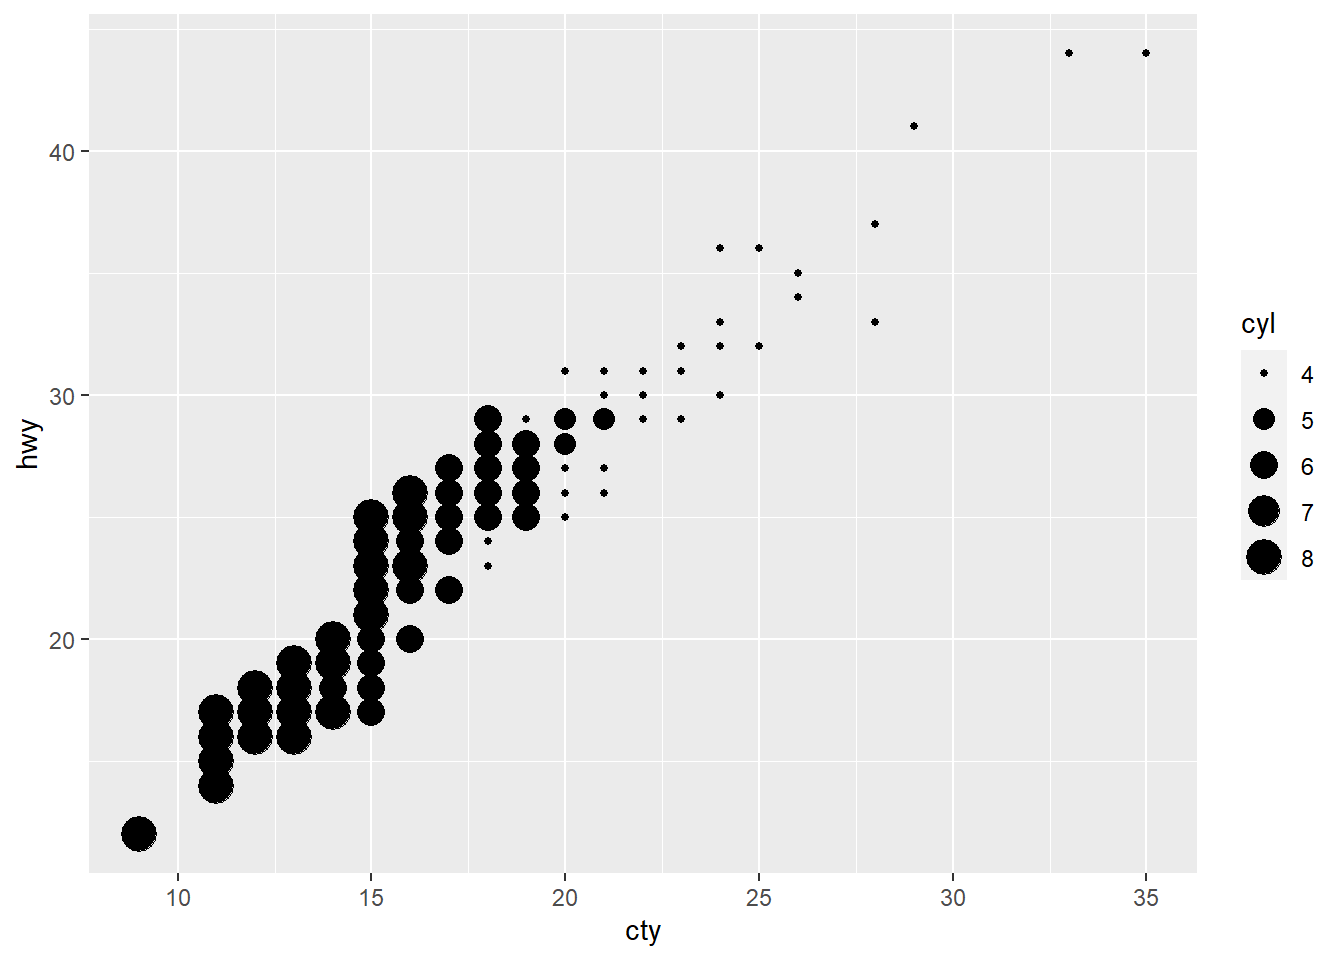
p+geom_point(aes(shape=manufacturer))Warning: The shape palette can deal with a maximum of 6 discrete values because
more than 6 becomes difficult to discriminate; you have 15. Consider
specifying shapes manually if you must have them.Warning: Removed 112 rows containing missing values (geom_point).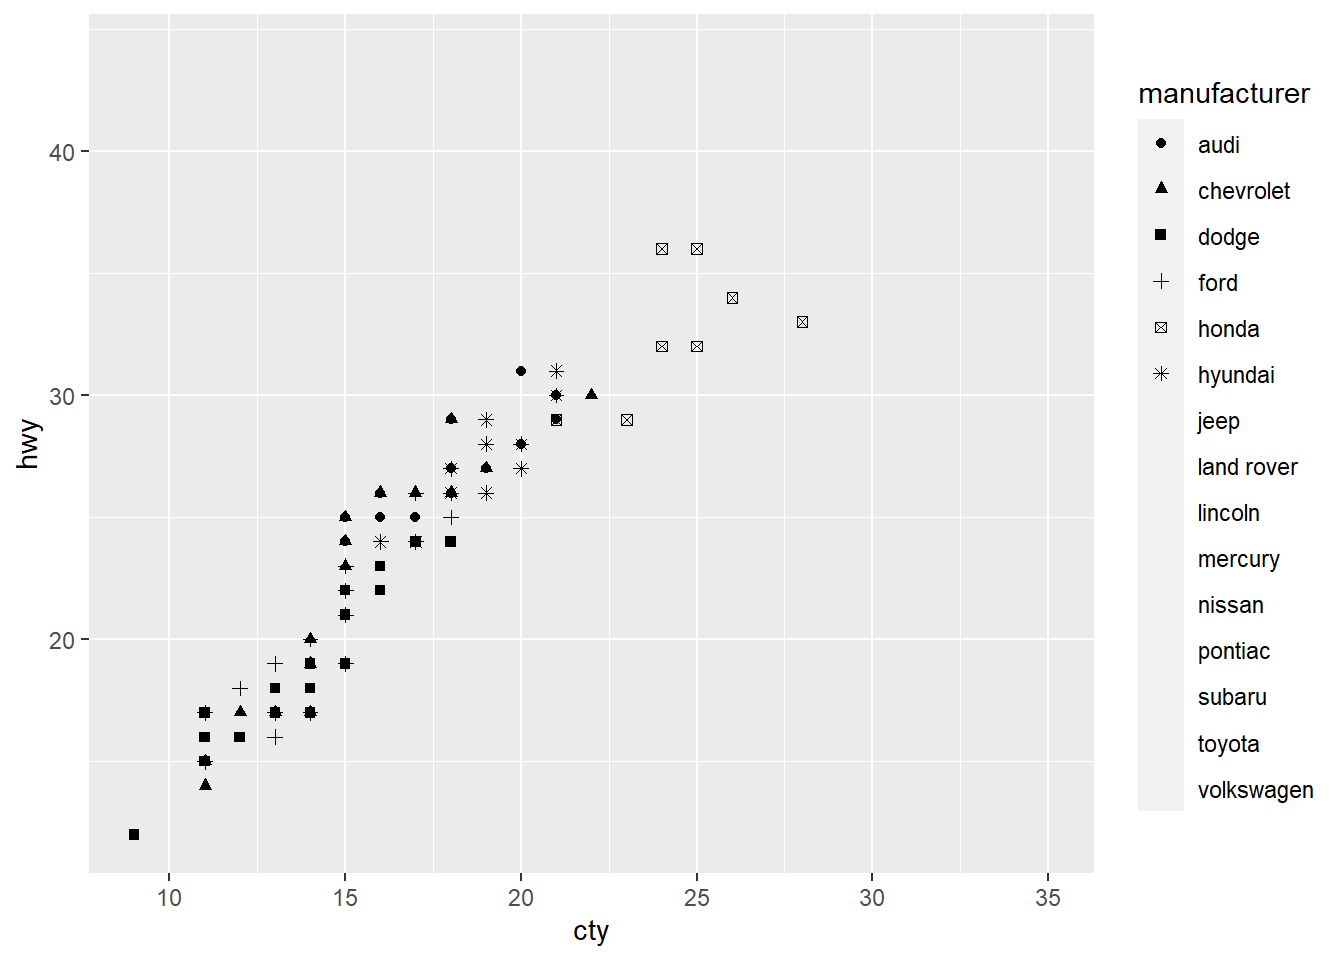
p+geom_point(aes(color=year))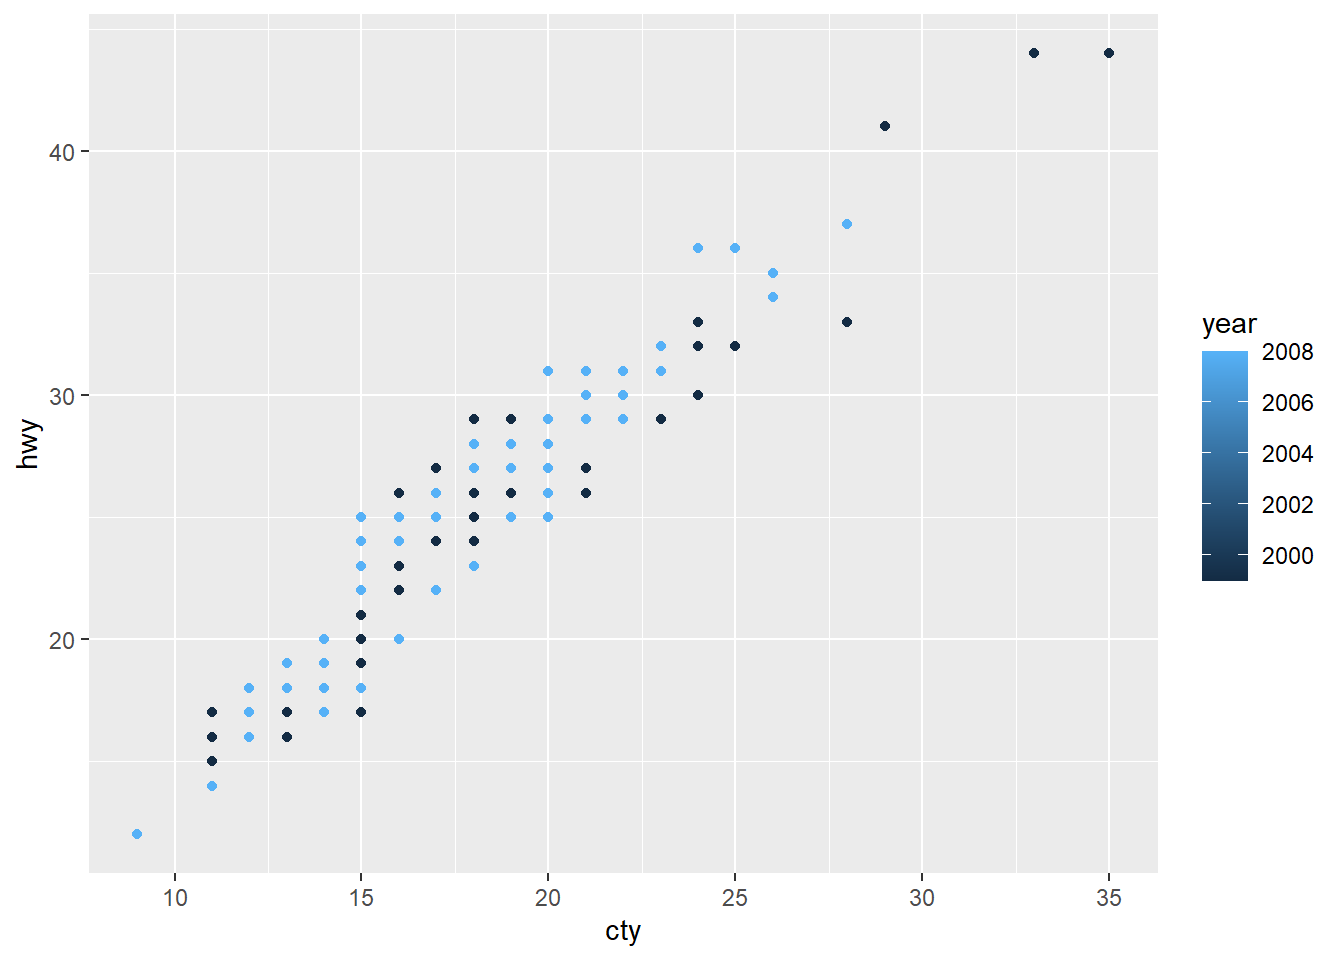
2.3 映射的原理
p+geom_point(aes(color=class))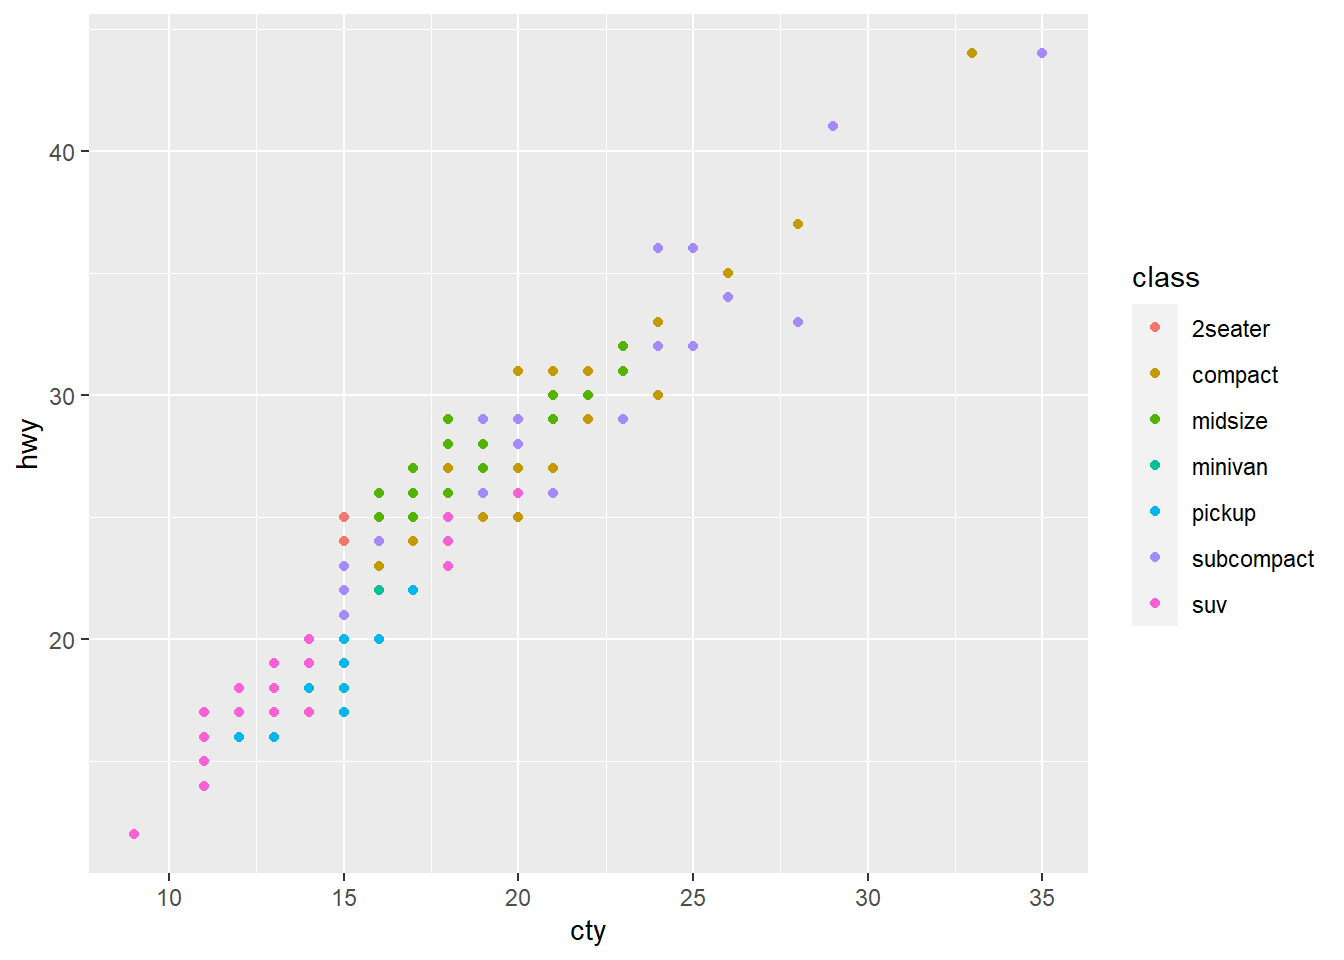
p+geom_point(aes(color="blue"))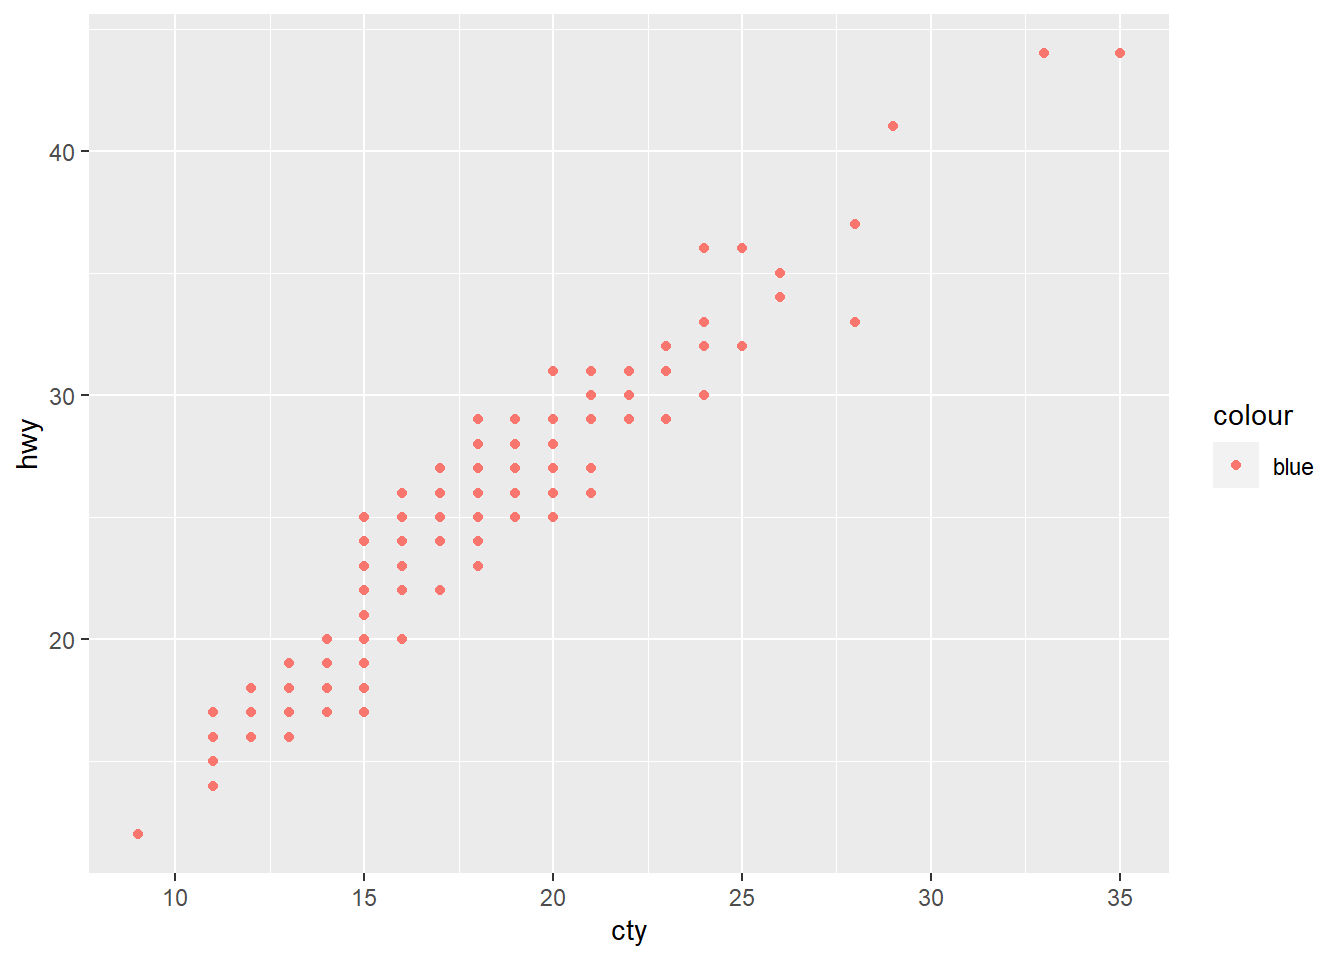
p+geom_point(color="blue")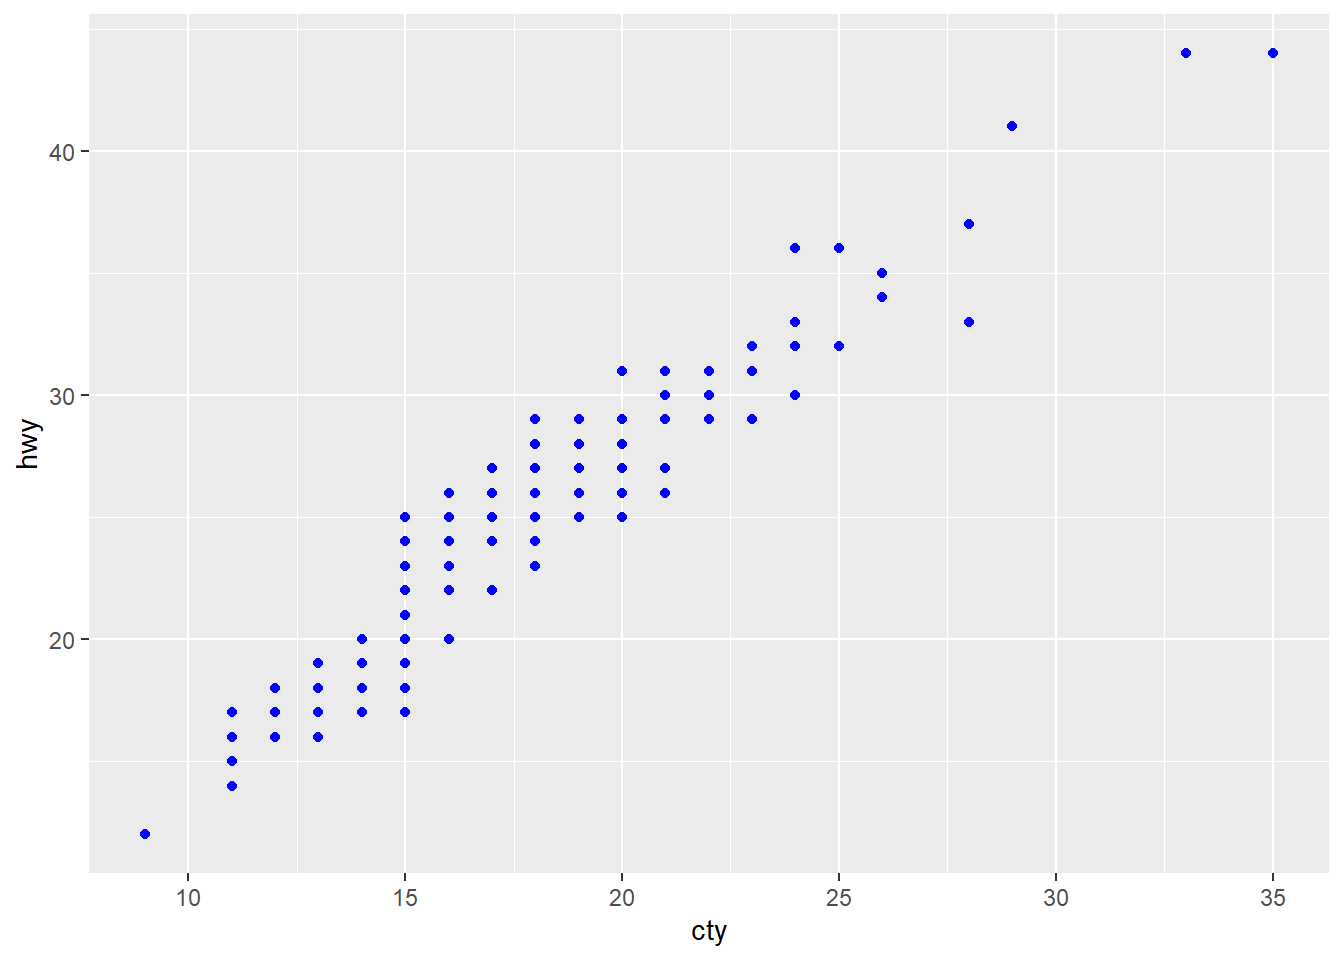
ggplot(mpg,aes(x=cty,y=hwy),color="blue")+
  geom_point()