── Attaching packages ─────────────────────────────────────── tidyverse 1.3.2 ──
✔ tibble  3.1.8      ✔ dplyr   1.0.10
✔ tidyr   1.2.1      ✔ stringr 1.4.1
✔ readr   2.1.3      ✔ forcats 0.5.2
✔ purrr   0.3.5
── Conflicts ────────────────────────────────────────── tidyverse_conflicts() ──
✖ dplyr::arrange()   masks plyr::arrange()
✖ purrr::compact()   masks plyr::compact()
✖ dplyr::count()     masks plyr::count()
✖ dplyr::failwith()  masks plyr::failwith()
✖ dplyr::filter()    masks stats::filter()
✖ dplyr::id()        masks plyr::id()
✖ dplyr::lag()       masks stats::lag()
✖ dplyr::mutate()    masks plyr::mutate()
✖ dplyr::rename()    masks plyr::rename()
✖ dplyr::summarise() masks plyr::summarise()
✖ dplyr::summarize() masks plyr::summarize()
lm_labels <- function(dat) {
mod <- lm(hwy ~ displ, data=dat)
formula <- sprintf("italic(y) == %.2f %+.2f * italic(x) ", round(coef(mod)[1], 2), round(coef(mod)[2], 2))
r <- cor(dat$displ, dat$hwy)
r2 <- sprintf("italic(R^2) == %.2f", r^2)
data.frame(formula=formula, r2=r2, stringsAsFactors=FALSE)}
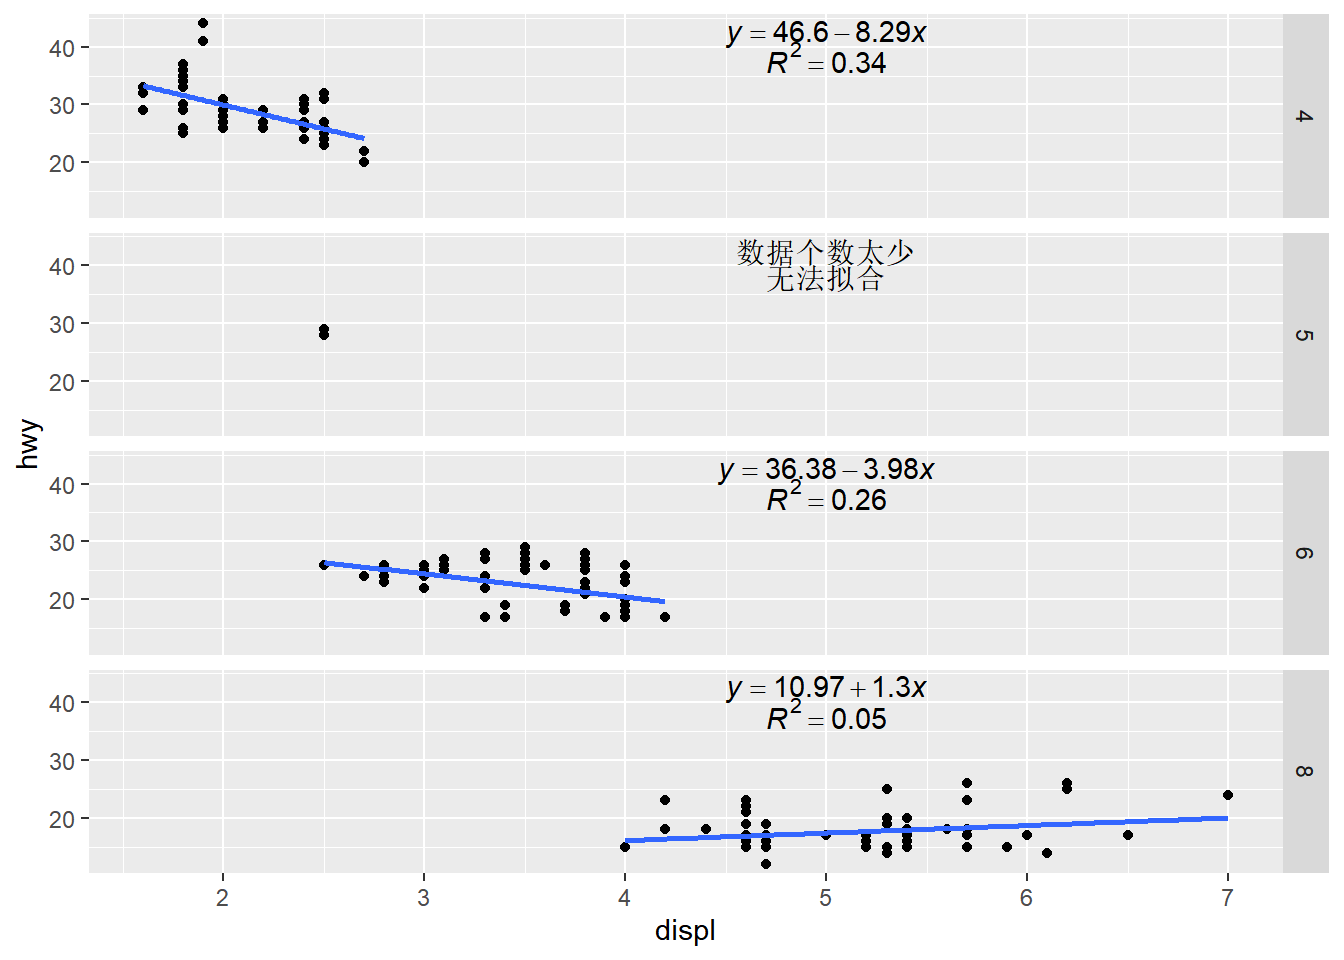
labels<-ddply(mpg,"cyl",lm_labels);labels[2,]<-c("5","数据个数太少","无法拟合")
Warning in cor(dat$displ, dat$hwy): the standard deviation is zero
  cyl                               formula                  r2
1   4 italic(y) == 46.60 -8.29 * italic(x)  italic(R^2) == 0.34
2   5                          数据个数太少            无法拟合
3   6 italic(y) == 36.38 -3.98 * italic(x)  italic(R^2) == 0.26
4   8 italic(y) == 10.97 +1.30 * italic(x)  italic(R^2) == 0.05
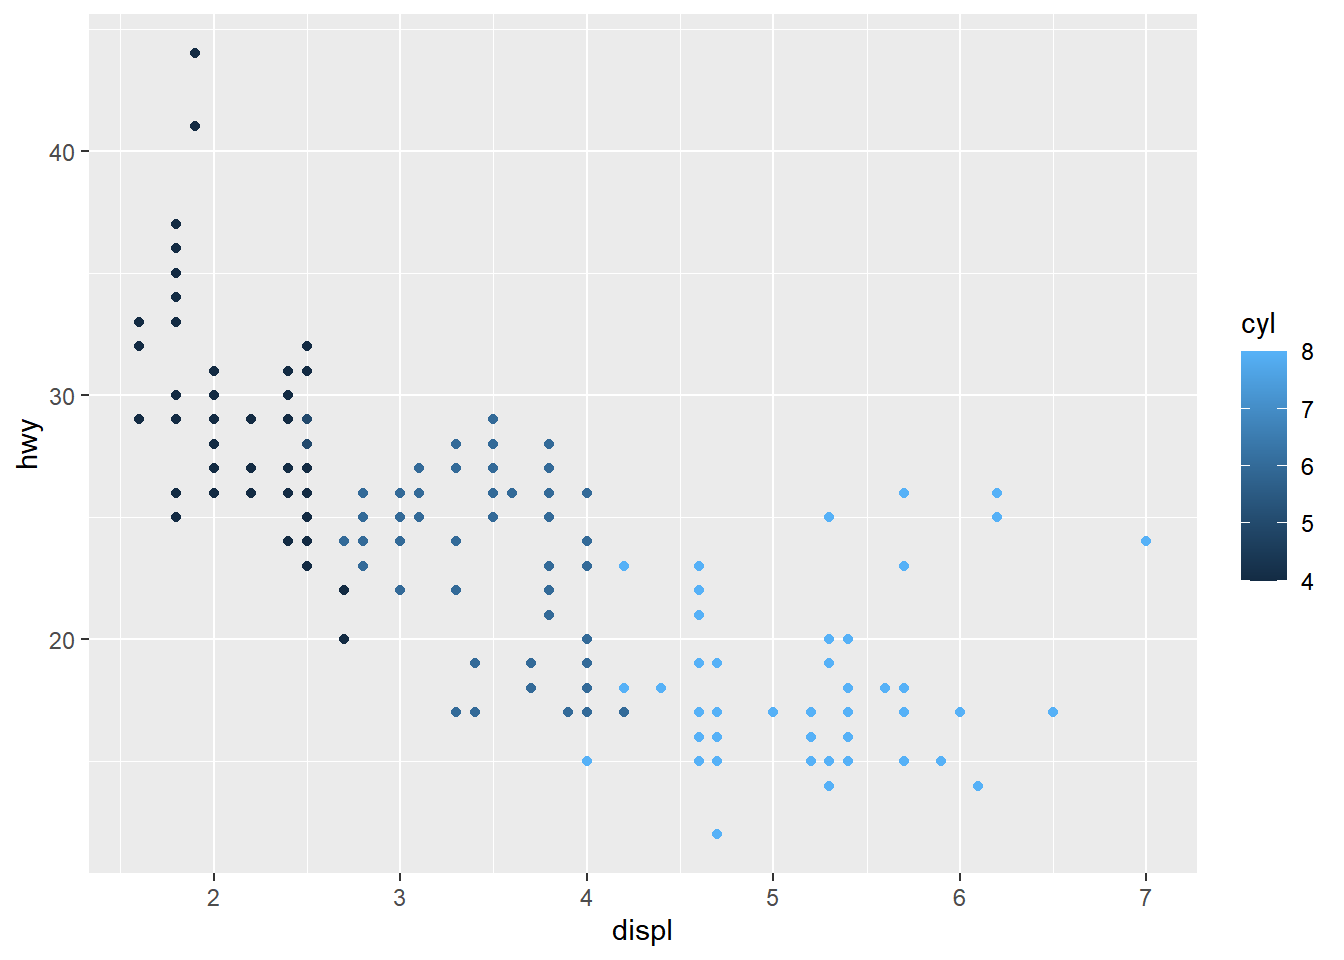
ggplot(mpg,aes(displ,hwy))+
geom_point()+
facet_grid(cyl~.)+
geom_smooth(se=FALSE,method="lm")+
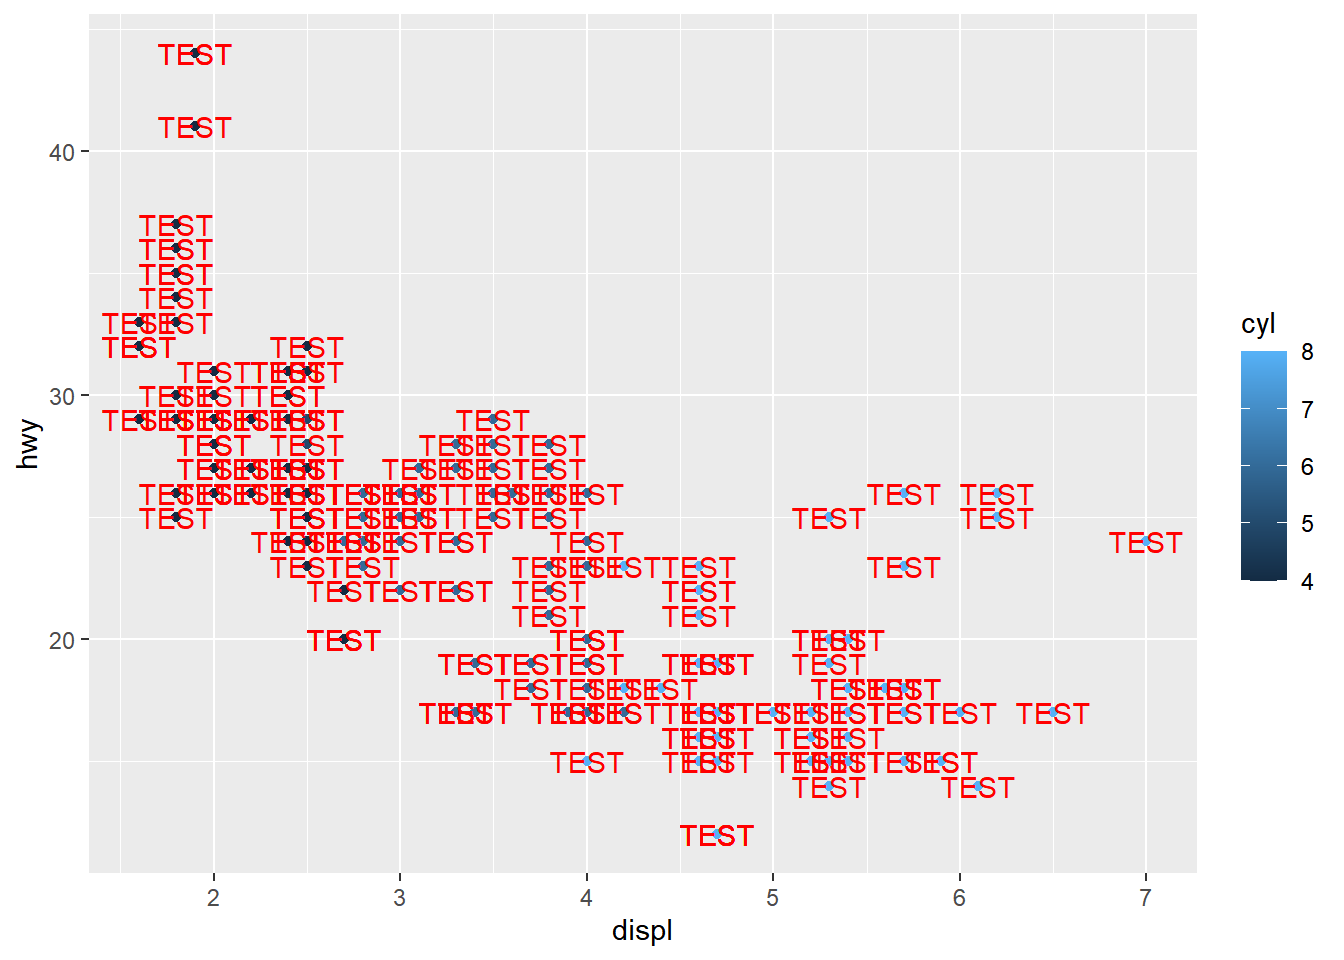
geom_text(x=5,y=40,aes(label=formula),data=labels,parse=TRUE,vjust=0)+
geom_text(x=5,y=35,aes(label=r2),data=labels,parse=TRUE,vjust=-0.1)
`geom_smooth()` using formula 'y ~ x'