── Attaching packages ─────────────────────────────────────── tidyverse 1.3.2 ──
✔ ggplot2 3.3.6      ✔ purrr   0.3.5
✔ tibble  3.1.8      ✔ dplyr   1.0.10
✔ tidyr   1.2.1      ✔ stringr 1.4.1
✔ readr   2.1.3      ✔ forcats 0.5.2
── Conflicts ────────────────────────────────────────── tidyverse_conflicts() ──
✖ dplyr::filter() masks stats::filter()
✖ dplyr::lag() masks stats::lag()11 guides()
guides(); guide_colorbar(); guide_legend()
11.1 scale_*_* VS guides()
df <- reshape2::melt(outer(1:4, 1:4), varnames = c("X1", "X2"))
p1 <- ggplot(df, aes(X1, X2)) + geom_tile(aes(fill = value));p1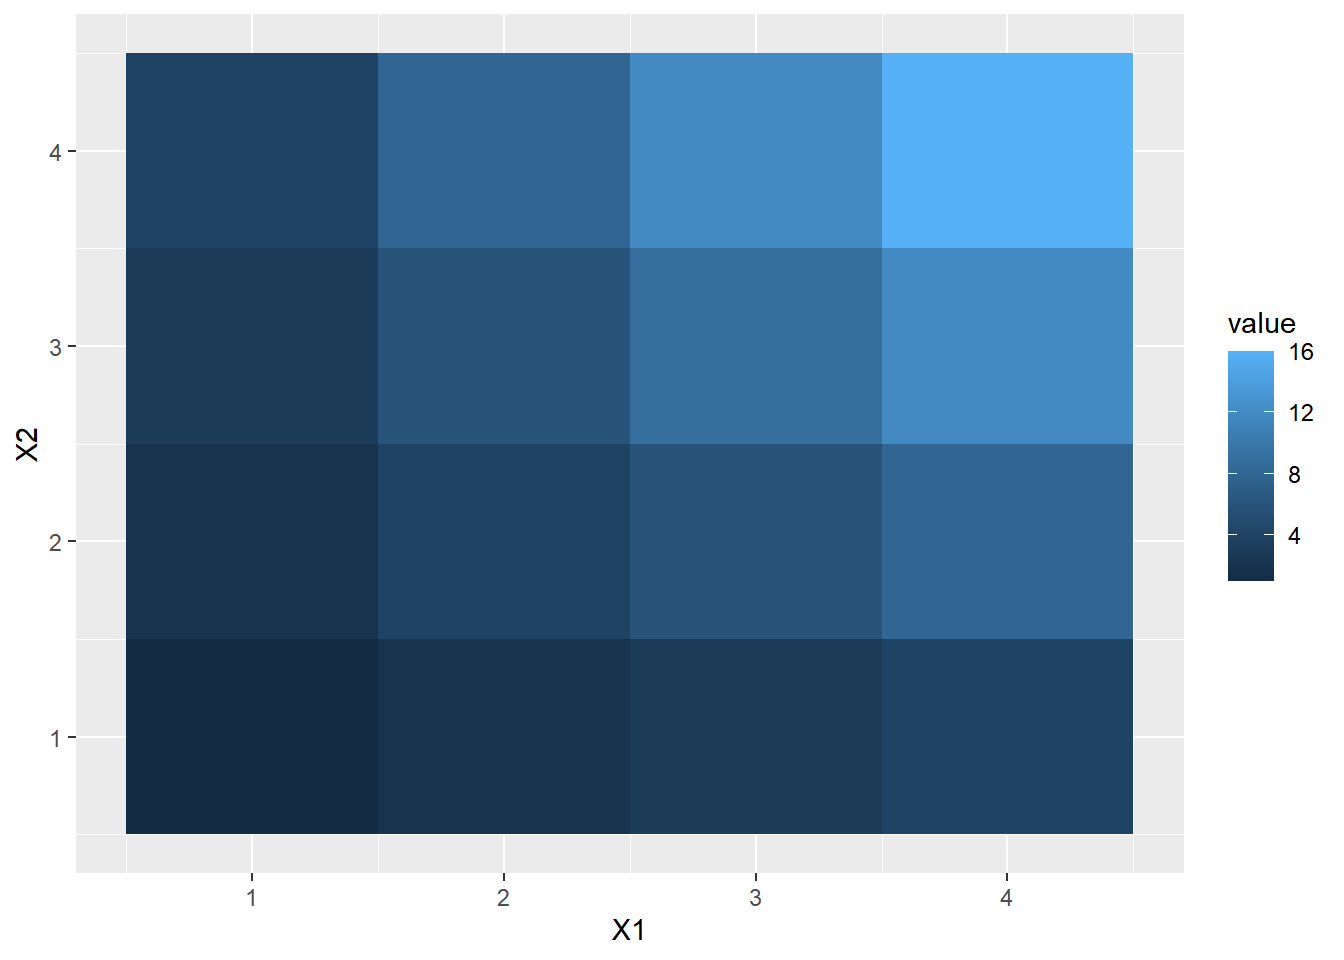
p1 + scale_fill_continuous(guide = "legend")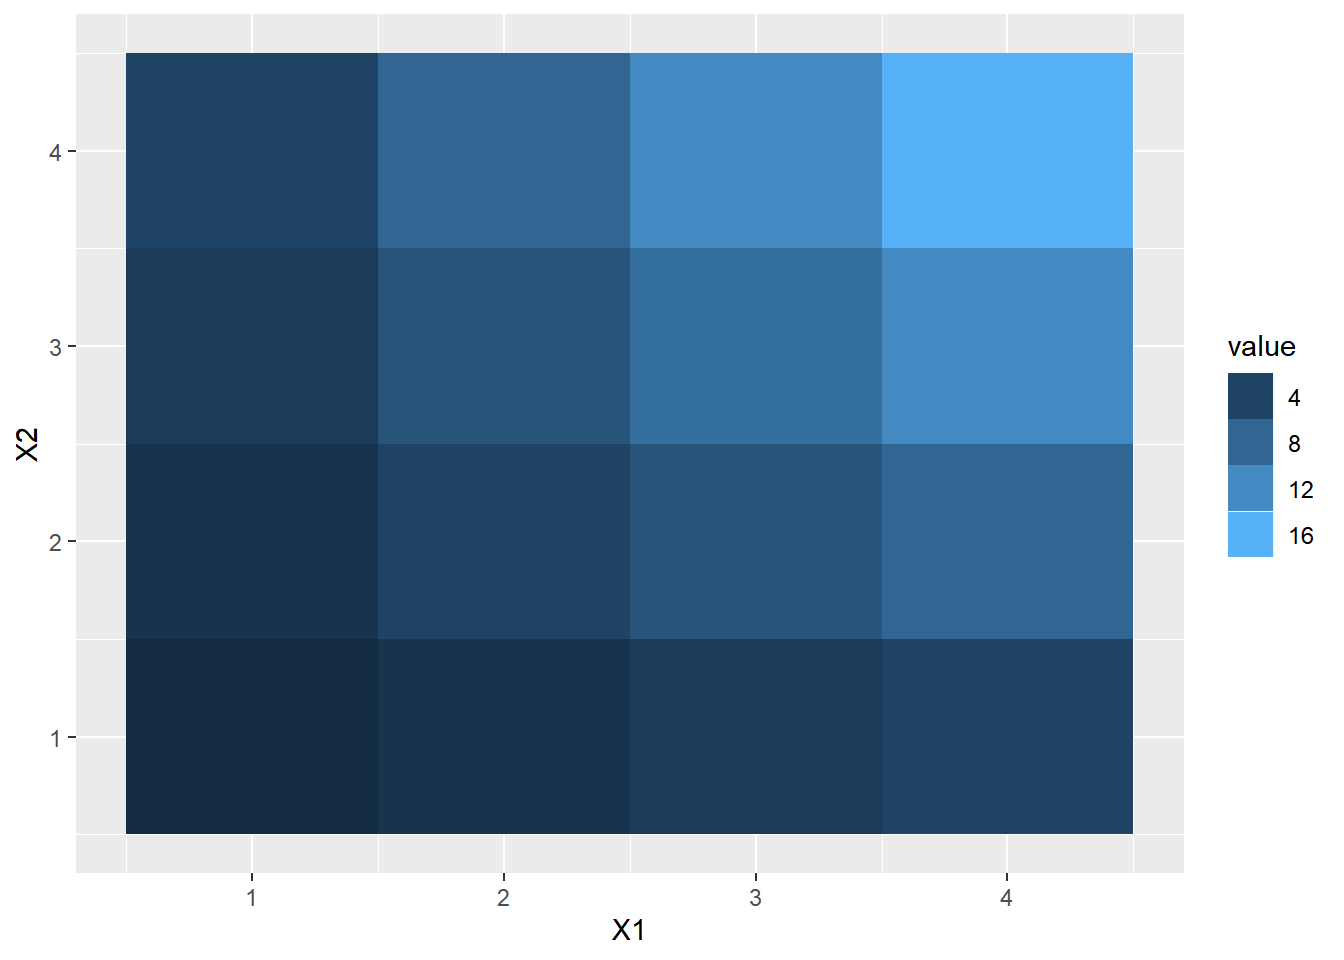
p1 + scale_fill_continuous(guide = guide_legend())
p1 + scale_fill_continuous(guide = guide_legend(title=NULL))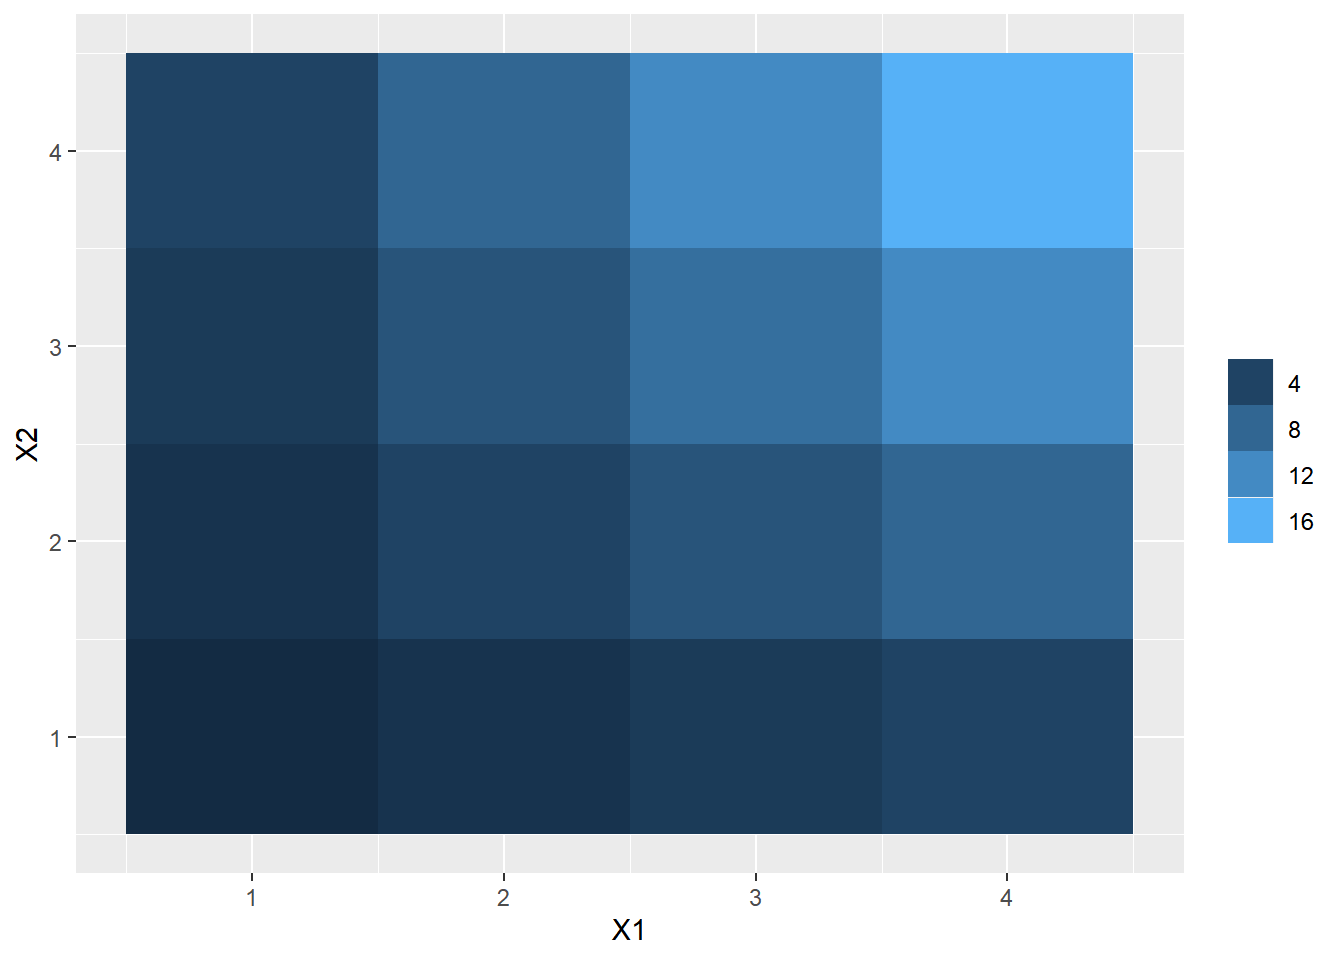
p1+guides(fill = "legend")
p1+guides(fill = guide_legend())
p1+guides(fill = guide_colorbar(title = NULL))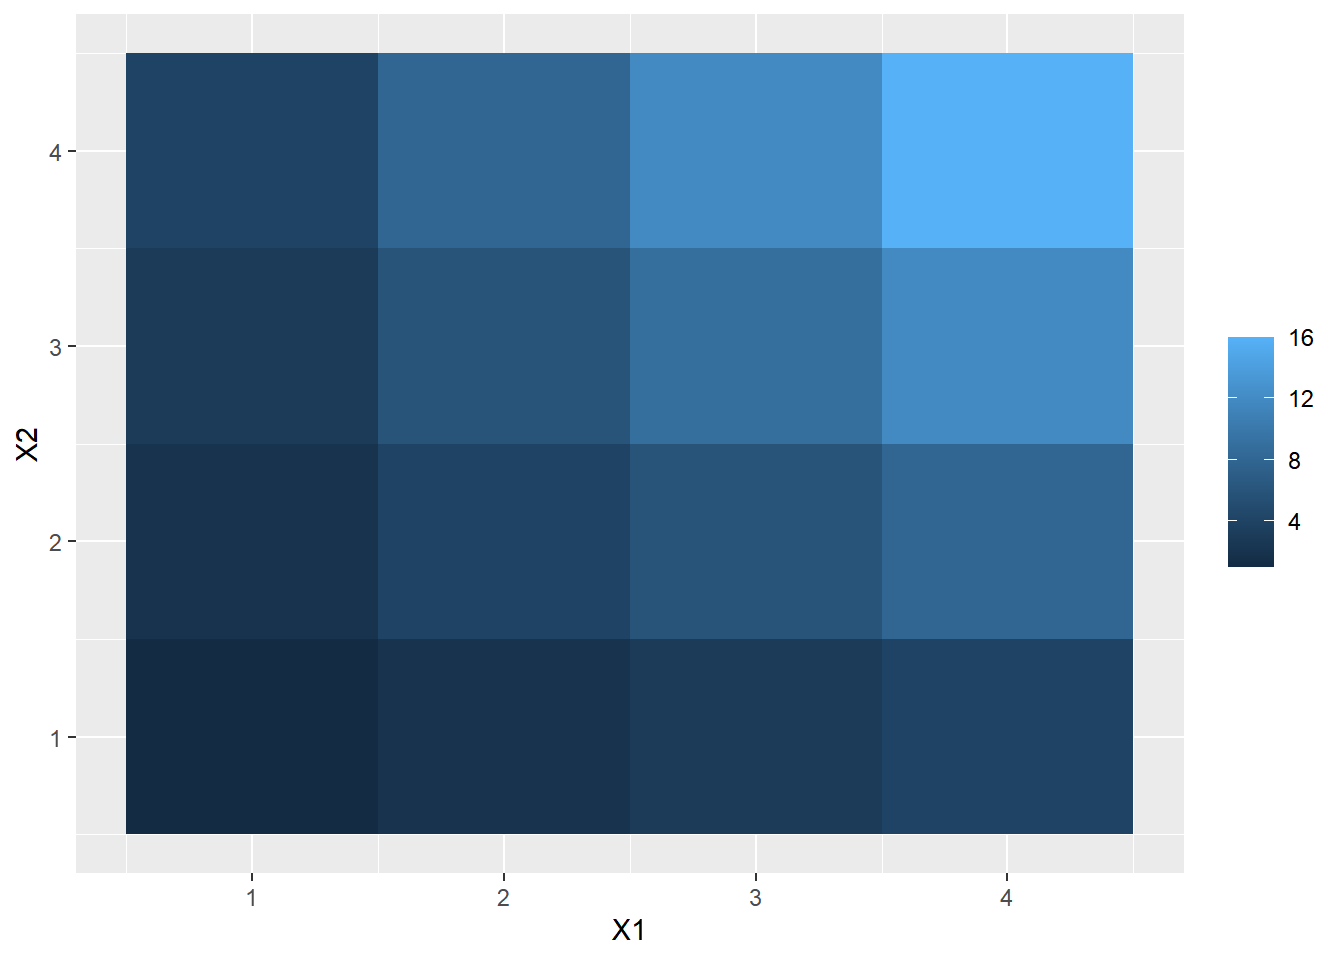
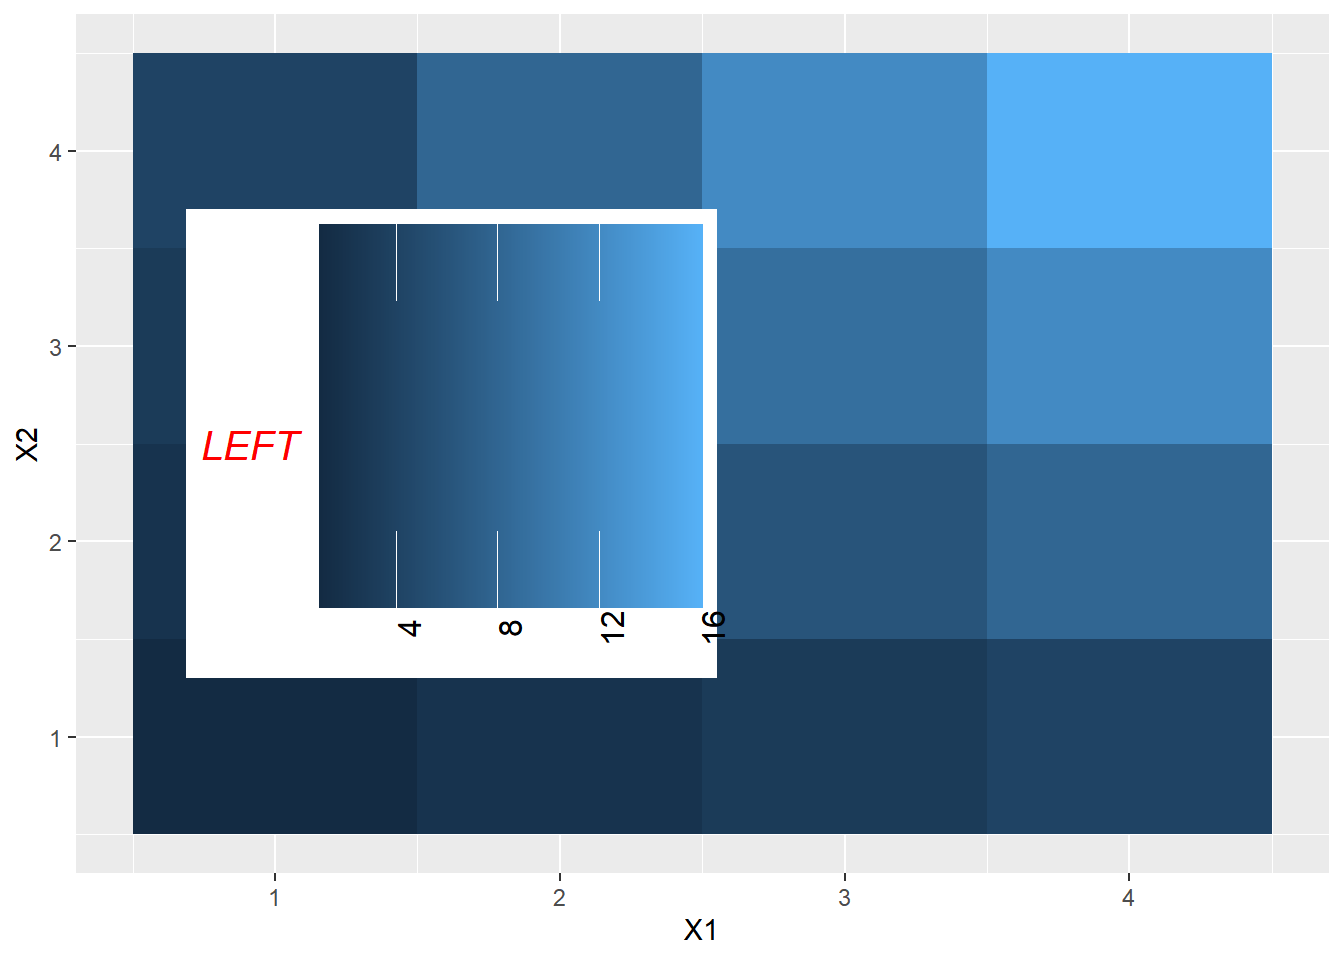
p2<-p1 + guides(fill =  guide_legend( title = "LEFT",
                                  title.position = "left",
                                  title.theme = element_text( size = 15,
                                                              face = "italic",
                                                              colour = "red",
                                                              angle = 0
                                                            ),
                                  label.position = "bottom",
                                  label.hjust = 0.5,
                                  label.vjust = 1,
                                  label.theme = element_text(angle = 90),
                                  direction = "horizontal",
                                  keywidth = 3,
                                  keyheight = 1,
                                  nrow=2,
                                  byrow=TRUE
                               )
            );p2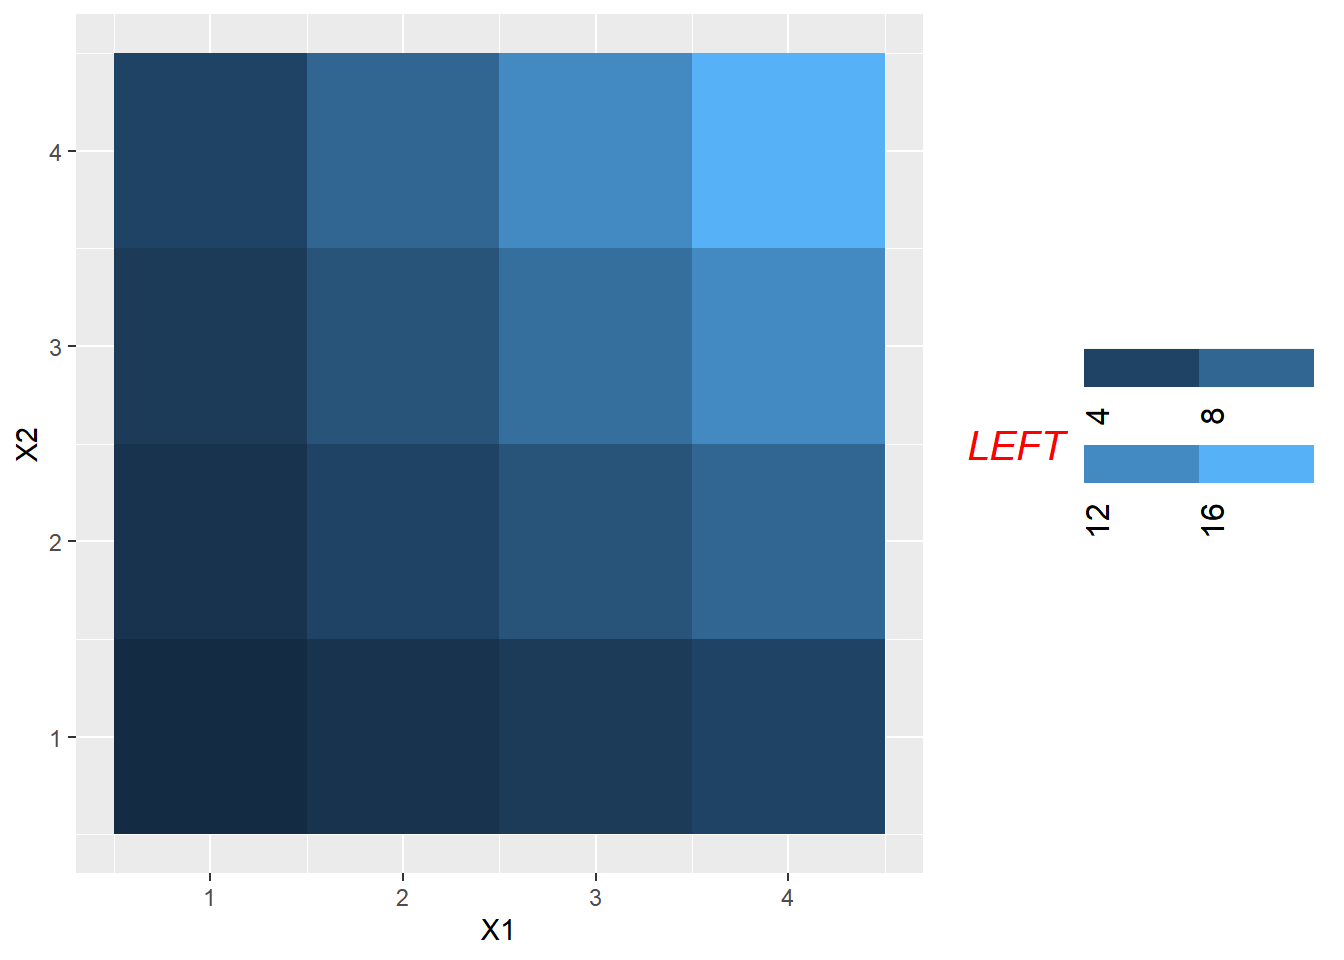
p3<-p1 + guides(fill =  guide_colorbar( title = "LEFT",
                                  title.position = "left",
                                  title.theme = element_text( size = 15,
                                                              face = "italic",
                                                              colour = "red",
                                                              angle = 0
                                                            ),
                                  label.position = "bottom",
                                  label.hjust = 0.5,
                                  label.vjust = 1,
                                  label.theme = element_text(angle = 90),
                                  direction = "horizontal",
                                  barwidth = 10, barheight = 10,
                                  nbin = 100,
                                  draw.ulim = FALSE,
                                  draw.llim = FALSE,
                                  ticks=TRUE
                                  )
            );p3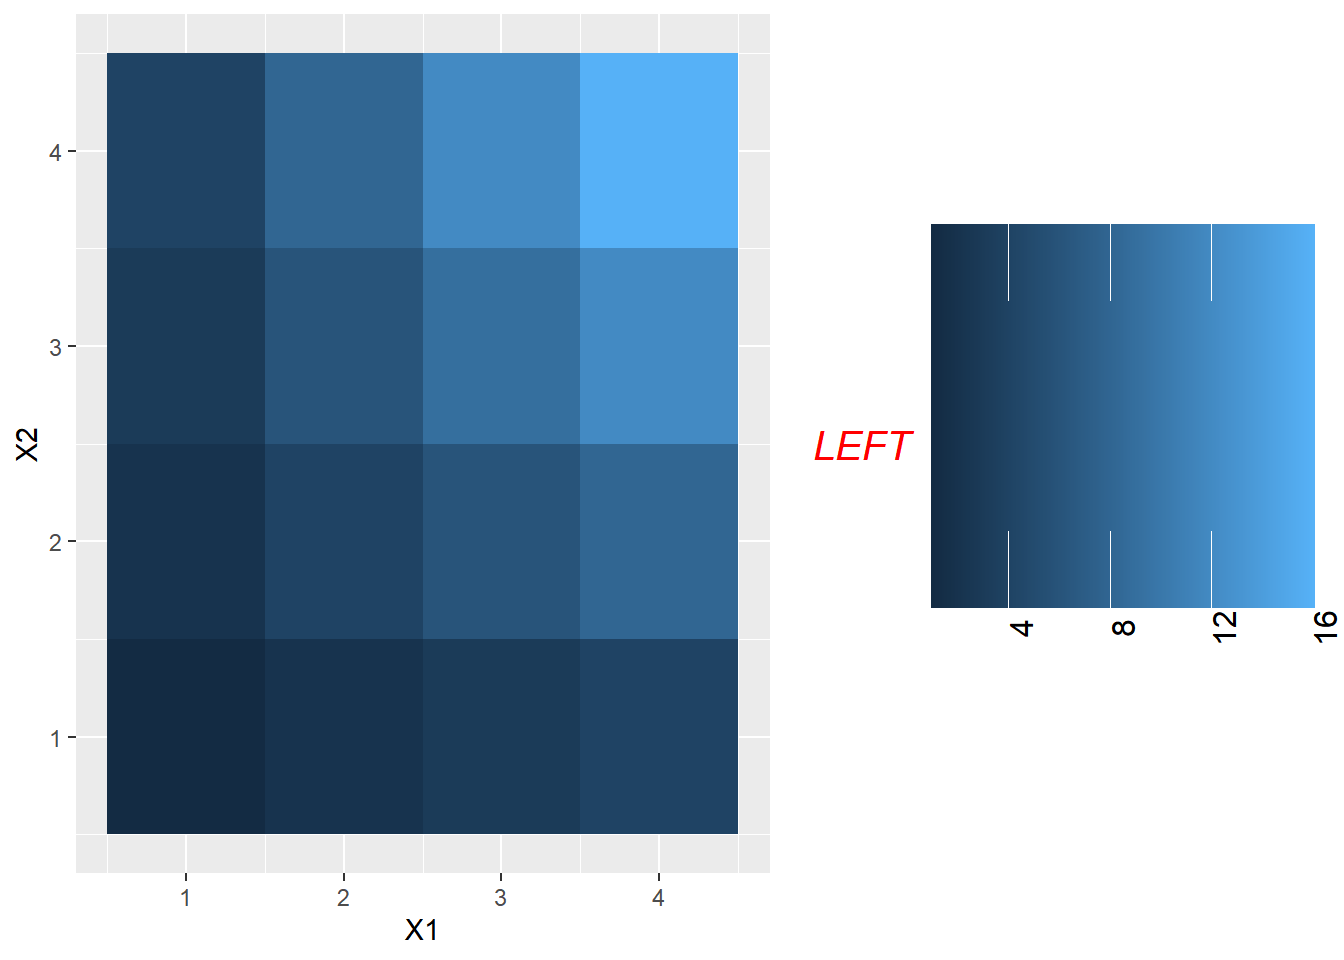
p2+theme(legend.position="top")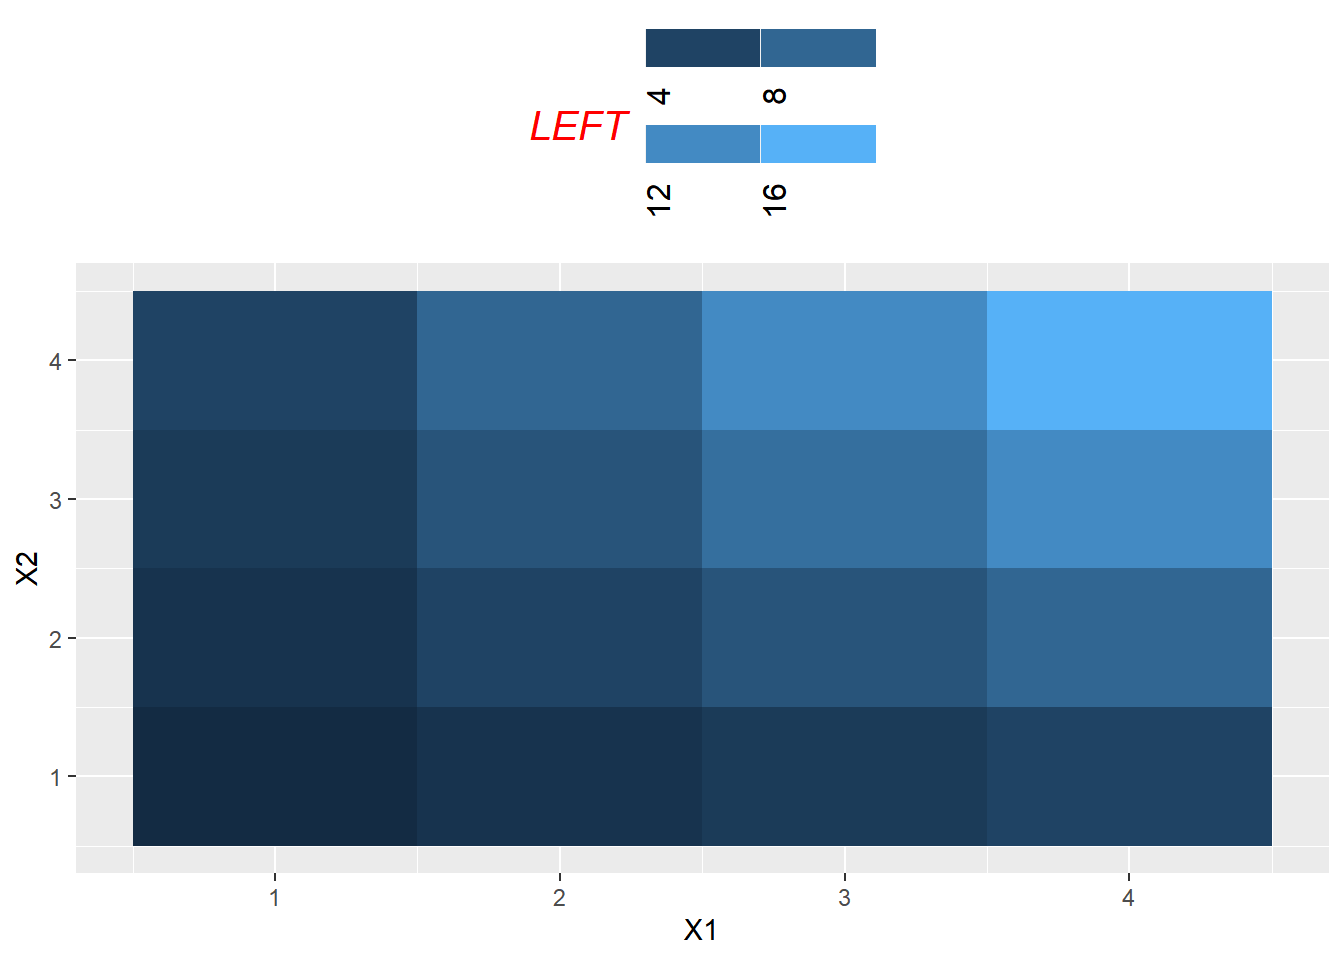
11.2 colorbar VS legend
mydata <- data.frame(  x = runif(100,0,100),
                        y = runif(100,0,100),
                        z = runif(100,0,100),
                        f = runif(100,0,100),
                        g = rep(LETTERS[1:5],each = 20))
p <- ggplot(mydata,aes(x,y))+  geom_point(aes(fill = z,size = f ),shape = 21);p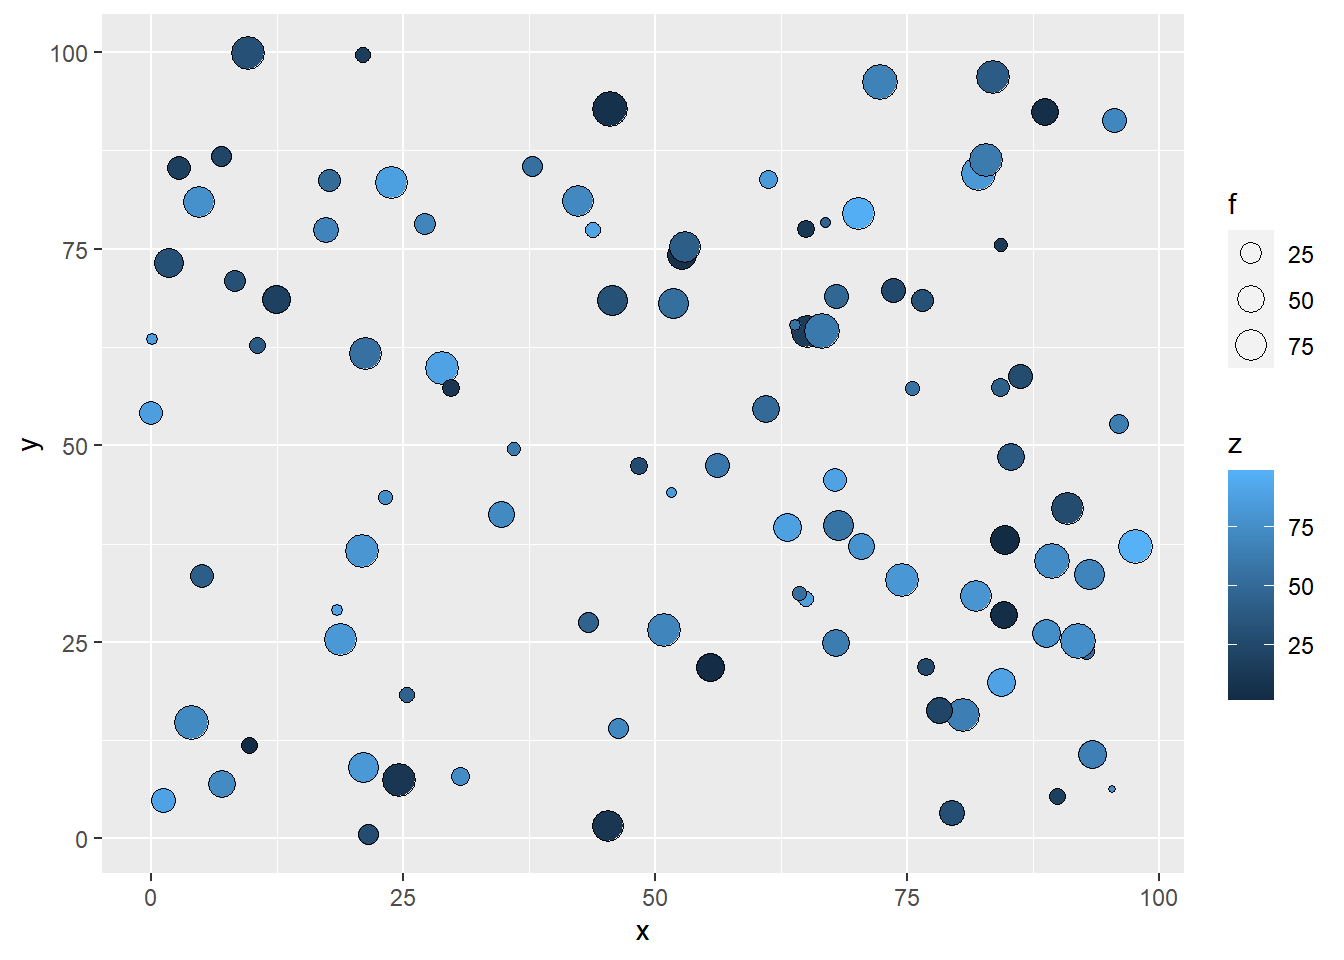
colorbar = guide_colorbar(  title = 'Colorbar',
                            title.position = 'left',  #left,right,top,bottom
                            title.theme = element_text(size = 15,face = "italic",colour = "red",angle = 45),
                            title.hjust =  .5,
                            title.vjust =  0,
                            label = TRUE,
                            label.position = 'top',
                            label.theme = element_text(size = 15,face = "italic",colour = "red",angle = 45),
                            label.hjust = .5,
                            label.vjust = .5,
                            barwidth = unit(6,"cm"),  #Default value is legend.key.width or legend.key.size
                            barheight = unit(1.2,"cm"),  #Default value is legend.key.height or legend.key.size
                            nbin = 20,
                            ticks = TRUE,
                            draw.ulim = TRUE,
                            draw.llim = TRUE,
                            direction = "horizontal",  #"horizontal" or "vertical."
                            reverse = TRUE,
                            order = 1)
size_legend = guide_legend(  title = 'legend',
                             title.position = "left",
                             title.hjust =  .5,
                             title.vjust = .5,
                             title.theme = element_text(size = 15,face = "italic",colour = "red",angle = 45),
                             keywidth = 2.5,
                             keyheight = 2,
                             label.position = "bottom",
                             direction = "horizontal",
                             label = TRUE,
                             label.hjust = 0.5,
                             label.vjust = 0.5,
                             label.theme = element_text(size = 15,face = "italic",colour = "red",angle = 45),
                             nrow = 2,
                             byrow = TRUE,
                             reverse = TRUE,
                             order = 2)
p + scale_fill_gradient(breaks = seq(0,100,10)) +
    scale_size_area(breaks = seq(0,100,10))  +
    guides(fill = colorbar,size = size_legend)
p+scale_fill_gradient(breaks=seq(0,100,10),guide=colorbar)+
  scale_size_area(breaks = seq(0,100,10),guide=size_legend)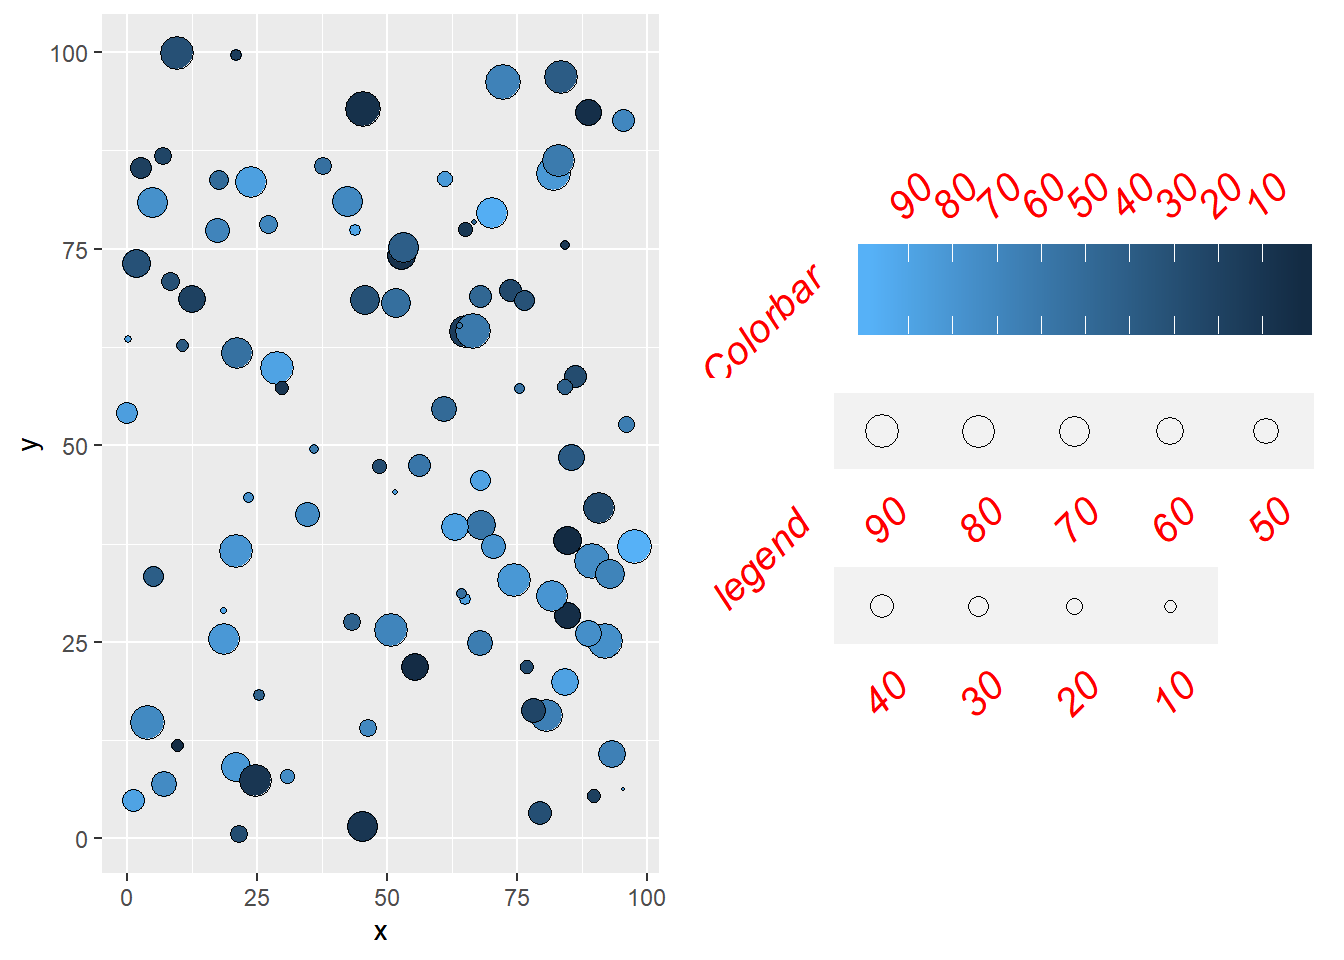
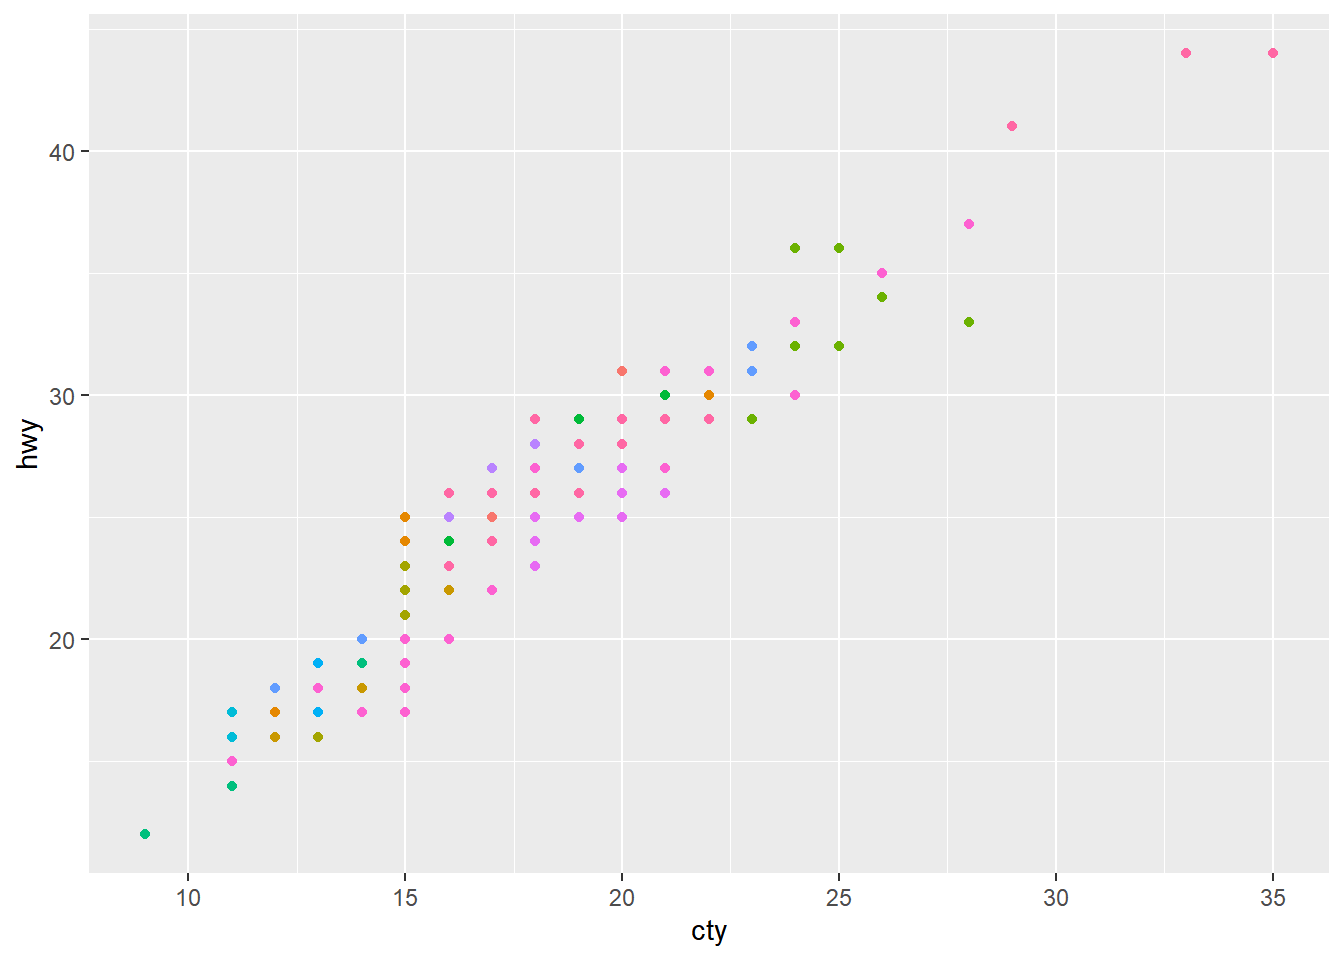
11.3 删除图例
ggplot(mpg)+
  geom_point(aes(cty,
                 hwy,
                 shape = manufacturer))+
  scale_shape_manual(values=seq(0,15,1),
                     guide=FALSE)
Warning: It is deprecated to specify `guide = FALSE` to remove a guide. Please
use `guide = "none"` instead.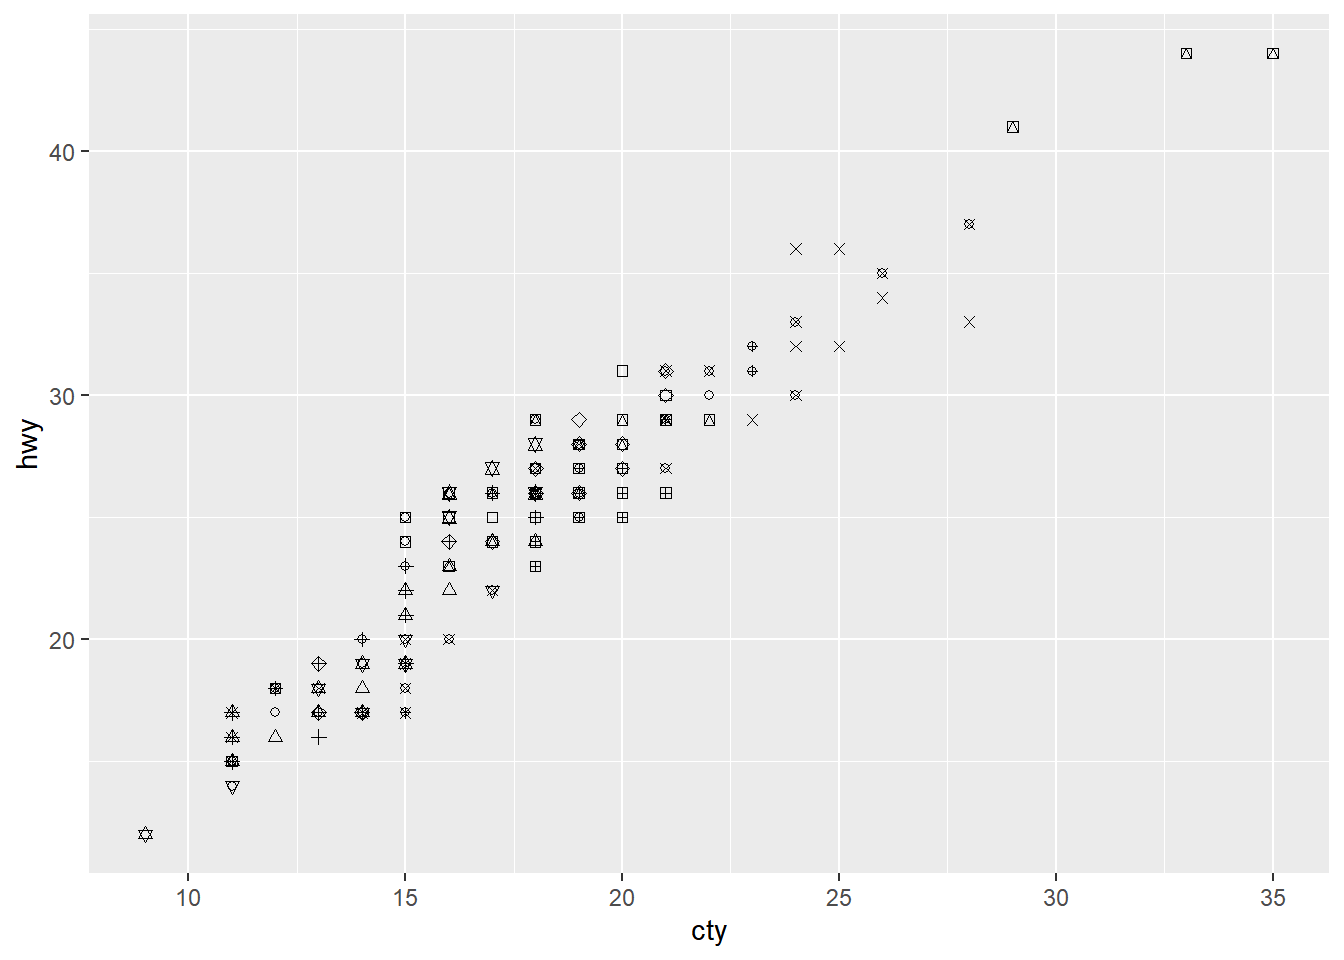
ggplot(mpg)+
  geom_point(aes(cty,
                 hwy,
                 shape = manufacturer))+
  scale_shape_manual(values=seq(0,15,1),
                     guide="none")
ggplot(mpg)+
  geom_point(aes(cty,
                 hwy,
                 color = manufacturer))+
  #guides(color=FALSE)+
  scale_color_discrete(guide=FALSE)
Warning: It is deprecated to specify `guide = FALSE` to remove a guide. Please
use `guide = "none"` instead.